Progress Report
SDG 11
January 2023
Reduce the housing shortfall in the region from approximately 7500 homes in November 2019 to a point where all our people are well housed by 2030.
ACHIEVING OUR TARGET
MEANS THAT:
All of our people will be well housed.
*We have used the UN rights to adequate housing entitlements in our definition for ‘well housed’. ’Well housed’ means timely access to habitable, affordable, accessible, culturally appropriate, appropriately located, housing with security of tenure.
Global Picture
According to the 2022 Demographia report[1], there has been an unprecedented deterioration in housing affordability[2], driven by the result of the pandemic and its related demand shock and it continues to disrupt standards of living, housing markets and national economies.
Further, it is likely that housing supply shortages in markets that have become more stringently regulated could have worsened the pandemic housing affordability losses. There has been a strong trend away from affordability. The number of severely unaffordable markets rose 60% in 2021 compared to 2019, the last pre-pandemic year.
There were also more seriously unaffordable markets. At the same time, the number of affordable and moderately affordable markets declined by nearly two thirds. At the national level, the number of severely unaffordable markets increased by 2 in Canada, by 3 in the United Kingdom and by 14 in the United States. Some markets have experienced exceptionally large median multiple increases in the two years since before the pandemic.
All of these increases are after prolonged housing affordability deterioration starting from 1990, when national price-to-income ratios were “affordable,” at 3.0 or less in Australia, Canada, Ireland, Aotearoa | New Zealand, the United Kingdom and the United States.
Aotearoa | New Zealand Picture
Te Tai Waiora Wellbeing in Aotearoa | New Zealand 2022[3] reports housing takes up a high share of our income in Aotearoa | New Zealand. Over the last two decades, house prices have been increasing faster in Aotearoa | New Zealand than in any other OECD country, and we have experienced the greatest increase in the ratio of house prices to income across OECD countries. Except for the Slovak Republic, we paid the highest share of our income on housing in 2019.However, renters tend to pay a much greater proportion of their income on housing than homeowners, following a large increase in the 1990s. Renters in the lowest income quintile also pay a larger share of their income on housing than similarly positioned renters in any other OECD country.
Te Tai Waiora Wellbeing in Aotearoa | New Zealand 2022[3] reports housing takes up a high share of our income in Aotearoa | New Zealand. Over the last two decades, house prices have been increasing faster in Aotearoa | New Zealand than in any other OECD country, and we have experienced the greatest increase in the ratio of house prices to income across OECD countries. Except for the Slovak Republic, we paid the highest share of our income on housing in 2019.However, renters tend to pay a much greater proportion of their income on housing than homeowners, following a large increase in the 1990s. Renters in the lowest income quintile also pay a larger share of their income on housing than similarly positioned renters in any other OECD country.
Renters also tend to live in houses of lower quality. Rentals tend to be smaller and are more likely to be crowded than owner-occupied housing and are also more likely to be in a poorer state of repair, less healthy and less conducive to stable tenure.
This situation is cause for concern in a context where owner-occupation rates have been falling for almost four decades and are lower than the OECD average, with first-home deposits taking almost twice as long to save as they did in 2011. Home ownership is also not equally distributed. Rates of home ownership are higher for Pākehā, for older people and for people who are not disabled.
These issues have resonance for young people, who are more likely to rent than own and are facing increasing challenges in getting on the housing ladder. Older age groups have disproportionately benefited from the long-term increase in house prices. Since the turn of this century, the gap between wealth of the over 65s and under 35s has more than doubled, with house prices being an important contributing factor.
There has also been an increase in the total number of people in severe housing deprivation between 2013 and 2018, defined as being without shelter or being in emergency and transitional accommodation. While the number of people without shelter or in publicly funded temporary accommodation fell over this period, there was an increase in those who were a temporary resident in a severely crowded private dwelling. We do not have more recent data on total severe housing deprivation as this data is only collected in the census. However, we have seen a continued upward trend in public housing applications in recent years, particularly for Māori. The number of households in emergency housing surged over the lockdown periods, particularly in Auckland. However, this surge has since subsided.
The Demographia 2022 report only records Auckland’s affordability relates to other world cities. Auckland has a severely unaffordable median multiple of 11.2. This is up from 8.6 in 2019, an increase of 2.6 times the annual median household income. Auckland ranks 85th in affordability out of 92 markets.
A 2022 update from Infometrics[4] looked at a new way to assess affordability by comparing the payments over the lifetime of the loan against the value of the asset when the mortgage has been repaid. This approach takes into account a broader range of factors that affect the financial costs and benefits associated with homeownership. Their report found that 2022 is the worst time since 1957 for first-home buyers trying to get into the housing market in Aotearoa | New Zealand, drive by two key factors:
The average proportion of a household’s income needed to service the loan throughout the mortgage: people taking on mortgages now are committing to having an average of 33% of their income tied up in mortgage repayments for the next 25 years or longer. At 49% of income, initial debt servicing costs are like 1987, but without the likelihood of the very strong income growth that quickly reduced the debt burden during the 1980s.
The increase in the value of the property over the life of the loan: the scope for house prices to rise rapidly from here, and provide today’s purchasers with significant capital gains, appears heavily limited. First-home buyers purchasing after a sustained period of strong house price growth risk buying at the peak of the market and enjoying less capital appreciation than buyers after a period of flat or falling house prices. Judging when the market is at its peak requires considerable foresight, but the reversal in house prices in the first half of 2022 suggests the boom that has persisted since the Global Financial Crisis has finally run out of momentum
Data from CoreLogic[5] reported in August 2022 that housing affordability reached the worst levels on record in 2021, declining abruptly following a 41% surge in the average property value during the COVID era. Affordability has now started to improve on most measures, however higher mortgage are likely to increase debt servicing costs relative to household income.
Comparing property value to income, Tauranga is the least affordable main centre, with a value to income ratio of 11.5 in Q2 2022. Auckland still has a value to income ratio close to 10, but it has also seen an improvement in the past three months as values have fallen and incomes have risen – as have Hamilton, Wellington, and Dunedin. Christchurch’s value to income ratio has risen a touch in the past three months, hitting 7.1, which is a new record high – albeit not too much different from the figure of 6.9 in both Q4 2021 and Q1 2022.
In terms of mortgage servicing, Corelogic reports even though property values have generally fallen in the past few months, the rise in mortgage rates has outweighed that effect, meaning that mortgage payments as a share of gross annual average household income have continued to increase in each of the main centres. In Auckland, Hamilton, Tauranga, and Dunedin, mortgage payments on a new 80% LVR loan currently absorb at least 50% of gross annual average household income, with Wellington’s figure sitting below that mark (47%), but still a record high. Christchurch’s figure for mortgage payments as a % of gross household income also rose in Q2 2022, hitting 44% – up from 39% in Q1 2022 and from just 28% a year ago.
For years to save a deposit, Tauranga also has the longest period of time required to save a deposit, at 15.3 years, well above its long term average of 10.7, but at least it’s started to improve – down from 15.5 in Q4 2021 and 15.9 in Q1 2022. However, almost all of the rest of the main centres also have a years to save measure in excess of 10, including Auckland (13.0), Hamilton and Dunedin (both 10.9), and Wellington at 10.2. These are all above their own long-term averages, but at least have improved since the record highs of Q4 2021 and Q1 2022. Christchurch’s figure for years to save of 9.4 is the only main centre below the 10 mark, but it’s still above its own long term average (6.9)
In terms of rent to income ratio: rental affordability has been steadier around the main centres in recent months, either remaining pretty flat or even improving a little (e.g. Auckland, Hamilton, Tauranga, and Wellington). However, Dunedin’s rental affordability got a bit worse in Q2 2022, and Christchurch also remains a less affordable place to rent than it was 6-12 months ago. Even so, in most of the main centres, rents as a % of gross annual average household income remain above long-term norms, meaning that affordability for tenants is still stretched – even more so, to the extent that renting households earn less than the average income.
On housing quality, data from Statistics New Zealand[6], compiled from the 2018 Census and General Social Survey showed that:
Dampness and mould were common in Aotearoa | New Zealand homes. Around 1 in 5 homes were damp sometimes and 1 in 6 had mould larger than A4 size.
1 in 5 Aotearoa | New Zealanders lived in a home that was always or often too cold in winter, but this rose to around 2 in 5 Pacific peoples.
Housing problems, such as cold, damp, and mould, were more common among households that were not owner-occupiers, did not have enough money for everyday needs, and had four or more household members.
Owner-occupier households were more likely to have efficient heating appliances, such as heat pumps and wood burners, than non-owner-occupier households. Owner-occupied households were also less likely to use portable gas heaters, or not to heat their dwellings at all.
Rental houses were more likely to be smaller, needing major repair, and were less likely to have double glazing. However, there was no significant difference in insulation between owned and not-owned dwellings.
Visible mould was most frequently observed in bathrooms (57 percent) and bedrooms (54 percent), compared with kitchens (28 percent) and living spaces (37 percent).
1 in 10 Aotearoa | New Zealand houses did not have any working smoke alarms, 1 in 3 had tap water that was too hot in their bathrooms, and 1 in 5 houses had trips and falls hazards.
Poor quality housing affects people’s wellbeing. Just over half of people who reported four key housing quality problems rated their overall life satisfaction poorly.
People living in damp, cold, and mouldy houses had more frequent colds and flu and were more likely to suffer from asthma. They also tended to have poorer mental wellbeing than people who lived in homes without these problems.
In 2018, most Aotearoa | New Zealanders found their home and neighbourhood suitable for their needs. However, non-owner-occupiers, people living in crowded housing, Māori, Pacific peoples, the unemployed, and sole parents tended to be less satisfied with their housing.
Size (too large/too small) was the most common reason that people rated their dwelling as unsuitable.
Housing suitability also has an impact on people’s wellbeing. Data from the 2018 GSS showed that people who thought their housing was unsuitable or very unsuitable rated their life satisfaction worse, on average, than those with suitable or very suitable housing.
In 2018, around 1 in 9 Aotearoa | New Zealanders lived in a crowded house, with the highest rates of crowding among Pacific peoples.
Household crowding was highest in Auckland and Gisborne regions, and within Auckland, 1 in 4 households in Mangere-Otahuhu and Otara-Papatoetoe were crowded.
Just under one percent of the population was estimated to be severely housing deprived (homeless) in 2018.
Rates of severe housing deprivation were highest among young Pacific peoples and young Māori, while overall, severe housing deprivation prevalence rates for Pacific peoples and Māori were close to four and six times the European rate.
[1] Demographia International Housing Affordability, 2022 Edition
[2] Demographia International Housing Affordability uses the “median multiple” to rate middle-income housing affordability. The median multiple is a price-to-income ratio of the median house price divided by the gross median household income.
[3] Te Tai Waiora: Wellbeing in Aotearoa | New Zealand 2022 (treasury.govt.nz). Detailed references are not provided here.
[4] Infometrics-Housing-Update-Report-2022.pdf
[5] Hope for housing affordability as property prices fall | CoreLogic Aotearoa | New Zealand
Waikato Picture
Waikato Progress Indicators
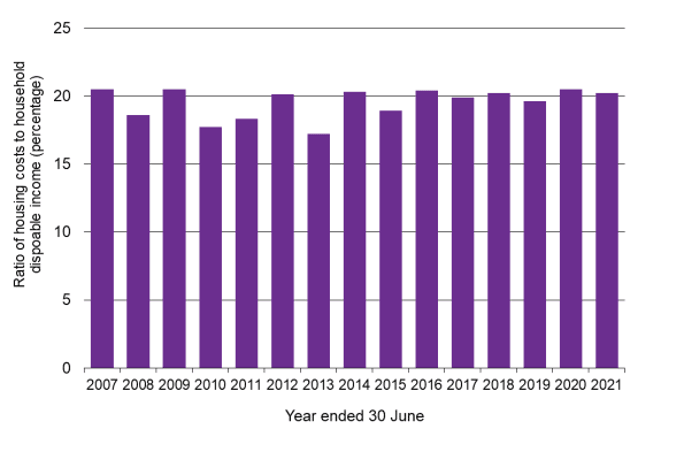
On average, households spent about one-fifth of their disposable income on housing costs. The ratio of housing costs to household disposable income at the regional level can vary substantially from year to year.
The Waikato region tends to have relatively more affordable housing than the national average, due to higher housing costs in Auckland where housing costs equate to around one-quarter of household income.
The ratio of housing costs to household income in Aotearoa | New Zealand is currently the highest in the OECD. Aotearoa | New Zealand is 40th out of 40 (mostly developed) countries in terms of housing affordability.
Insights from the Waikato Housing Stocktake (2018)
Housing Demand and Supply
There is now a need for ~ 8,000 houses in specific locations in the Waikato region (~4,000 houses in Hamilton). All territorial authorities in the Waikato region, except for Taupō, have a housing shortfall. If Taupō was included, the net regional shortfall would be ~7,500. Taupō has a housing surplus of ~500. Looking further out to 2043 (~25 years away) and using the medium projection from Statistics New Zealand, an additional 51,000 houses are required in the Waikato region. Under the high projection scenario, the number of houses needed is~ 75,000. In the short term there is the challenge of closing the estimated shortfall gap.
Housing Affordability
In an indicative analysis of varying income levels and mean household expenditure, it is apparent
that it would be a challenge to purchase a $529,000 house (the Waikato region median house price) with a 20 per cent deposit and a mortgage if the gross annual household income is $100,000. The household would need to reduce average household expenditure by $2,000 per annum. Additionally, it should be noted that the median household income for Aotearoa | New Zealand is $85,000, which suggests that the median house price is not attainable for many people. Further to this, Hamilton is the third (after Auckland and Tauranga) least affordable housing market in Aotearoa | New Zealand, with a median house price to median household income of 6.8 times (three times is considered affordable). Related to affordability is social housing, where recent demand for the social housing register has grown dramatically in the Waikato region, from 381 in December 2017 to 896 in December 2018 (an increase of 135 per cent).
Housing Quality
There is limited information on the quality of housing in the Waikato region but what is available indicates that the Waikato has an ageing stock profile (~54 per cent of housing stock was built after 1980), with 53 per cent of households potentially benefitting from retrofitted roof space and/or subfloor insulation.
Housing accessibility
Housing accessibility is of importance to those with disabilities and/or advanced age as these members of our communities are likely to spend more time at home. Having suitable and accessible homes is important so that health and safety is not compromised. A Statistics New Zealand survey indicated that disabled people are more likely to live in a rental home, find it harder to keep their homes warm, and to live alone or as part of a couple (relative to non-disabled people). With the expected increase in the ageing population improving accessibility will become more of a focus.
For more information refer to the Waikato Housing dashboard referred to in section 3.4