Progress Report
SDG 12
January 2023
Increase the number of households, schools, businesses and farms who reduce their waste leading to a 50% reduction of waste to landfill by 2030.
ACHIEVING OUR TARGET
MEANS THAT:
Our region is producing less waste through designing waste out of our daily lives, we’re reusing things where we can, and we’re using innovative and effective systems for recycling.
Global Picture
In 2021, 83 policy instruments supporting the shift to sustainable consumption and production were reported by 26 countries, bringing the total number of policies developed, adopted and/or implemented up to 438 (as reported by 59 countries and the European Union for 2019–2021). However, the distribution of reported sustainable consumption and production policies has so far been uneven, with 79 per cent of policies reported by high-income and upper middle-income countries, 0.5 per cent by low-income countries and only 7.7 per cent by least developed countries, landlocked developing countries and small island developing States.
The global material footprint continues to grow, although the pace has slowed. The average annual growth rate of the global material footprint for 2015–2019 was 1.1 per cent, compared with 2.8 per cent for 2000–2014, indicating a slowdown in the growth of economic pressure on the environment.
By December 2020, 40 countries had reported on sustainable public procurement policies and action plans (or equivalent legal dispositions) to encourage the procurement of environmentally sound, energy-efficient products and to promote more socially responsible purchasing practices and sustainable supply chains.[1]
Aotearoa | New Zealand Picture
MfE[2] reports that Aotearoa | New Zealand generates 17.49 million tonnes of waste per year, of which an estimated 12.59 million tonnes are sent to landfill. This estimate includes waste disposed of to Classes 1, 2, 3 and 4 landfills, clean fills, and farm dumps. It also includes the materials recycled in Aotearoa | New Zealand and those sent offshore for recycling.
Waste sent to Class 1 landfills (landfills that accept household waste) increased by 47 per cent from 2,499,571 tonnes in 2009/2010 to 3,682,419 tonnes in 2018/2019, with per capita waste increasing from 580kg to 740kg per annum. While there was a slight decrease in waste to Class 1 landfills in 2019 and 2020, with the decrease in 2020 likely largely due to COVID-19, longer term trends suggest the rate of waste disposal is only increasing for many sites around the country.
Construction and demolition waste is the largest source of waste to Class 1 landfills at 33 per cent followed by potentially hazardous waste at 24 per cent and then organic waste at 15 per cent. Since 1950:
food and garden waste to landfill has decreased from 28 per cent to 15 per cent
paper has decreased from 16 per cent to 6 per cent
timber waste has increased from 7 per cent to 12 per cent
non-greenhouse gas emitting waste (inert waste) which includes plastics and other materials has increased from 45 per cent to 57 per cent.
Waikato Picture
Waikato Progress Indicators
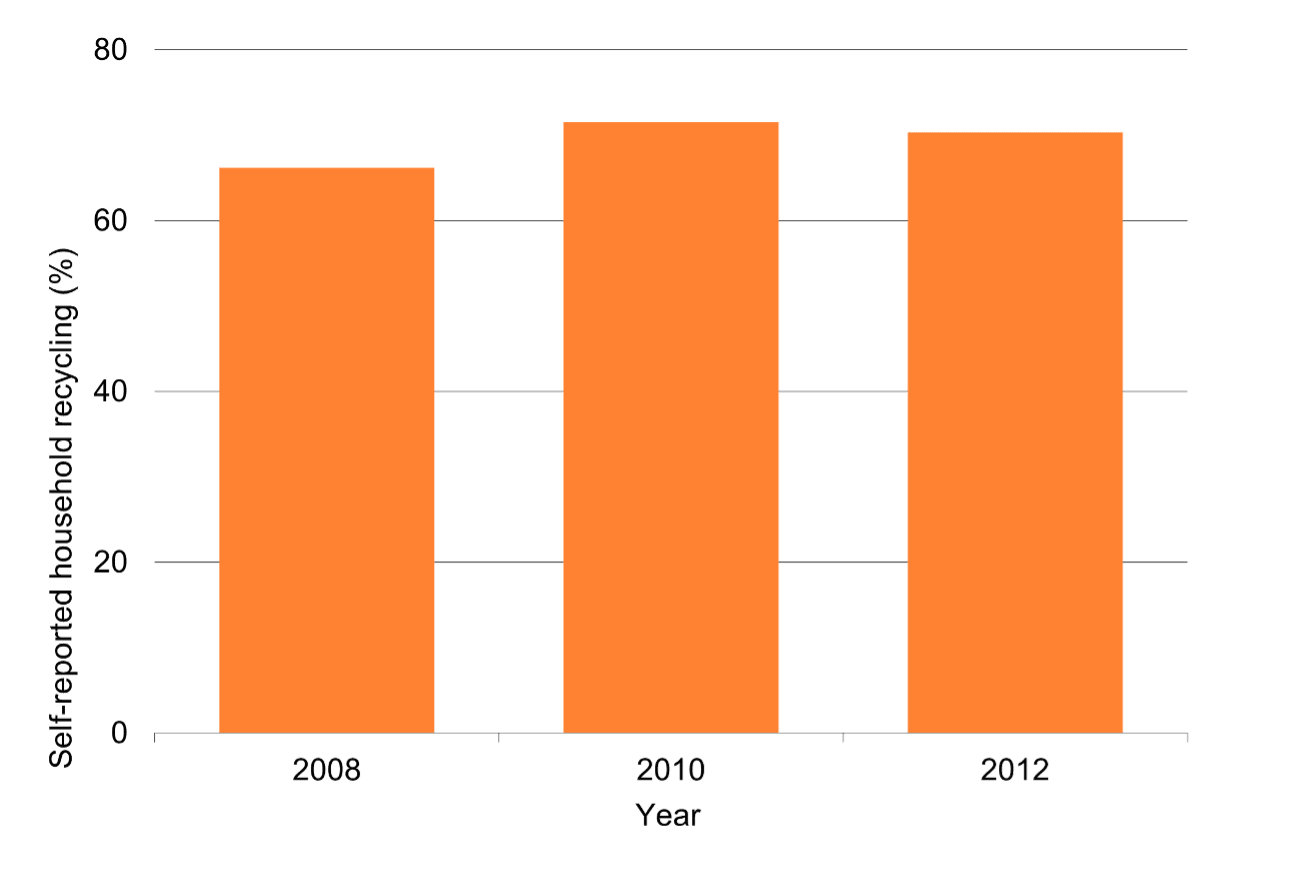
This indicator is currently only updated every 10 years and lacks local/regional gathering of data.
Between 2008 and 2012, the percentage of people surveyed in the Waikato region who said their household recycles ‘all/most of it’ increased from approximately 66% to 70%.
Despite this improvement, growth in self-reported recycling has lagged that of Auckland, Wellington and Christchurch which rate 80-90% on this survey item.
According to results from the three-yearly ‘Your Environment – what matters’ survey of Waikato Region residents, in 2022 around 40% of the surveyed population listed ‘recycle in general’ as one of their most common personal environmental actions, like the 2019 result.
Insights from the Waikato Waste Prevention Action Plan 2020-25[1]
The Waikato region has five disposal sites associated with industrial operations and five municipal solid waste landfills. Most of our open landfills are quite small, except Hampton Downs, which receives around 600,000 tonnes of waste per year, and Tirohia which receives 120,000 tonnes of waste per year. We also have more than 13 consented cleanfills of significant size. Two of these are as managed fill sites (Class 3), the rest are controlled fill sites (Class 4). In 2020 two consent applications were being processed by Waikato Regional Council for two new managed fill sites (Class 3) of quite significant size. Over 40 other landfill sites have closed as they could not meet modern environmental standards.
Disposal to landfills is increasing and wastes from areas outside our region (such as from Auckland, Tauranga and as far as Gisborne) are being brought into the Waikato region for disposal. This means our environmental resources as well as our ratepayers may be disproportionately affected by the potential long term negative effects of landfilling.
In 2017, estimated waste disposed of to landfill for the Waikato region was 220,741 tonnes, which is 552 kg per capita. An estimated additional 300,000 tonnes of waste were being transported into the region from Auckland, Bay of Plenty and Gisborne (unpublished Regional Waste Stocktake, 2018). Construction and demolition (27.5%) and putrescible waste (food and green waste, 25.9%) are the two largest categories of waste going to landfill.
By 2022, Matamata-Piako, Hauraki, and Waikato district councils have a goal in their Waste Minimisation and Management Plans to reduce residential per capita waste to between 316kg and 351kg per year, which would be a reduction of around half of the current amount. Thames-Coromandel District Council has a goal to reduce to 599kg and Waipā to 450kg. Other Waikato councils have opted for a percentage reduction over a period of years. Auckland has a goal to reduce total regional waste to 582kg per capita and residential to 88kg by 2028
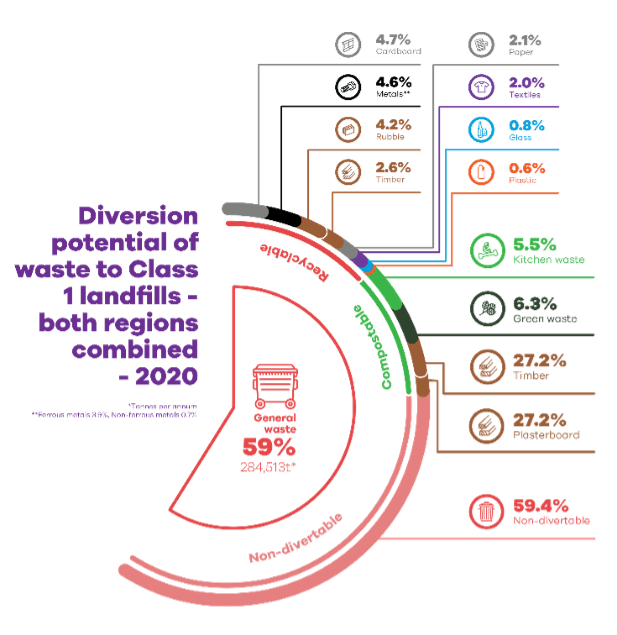
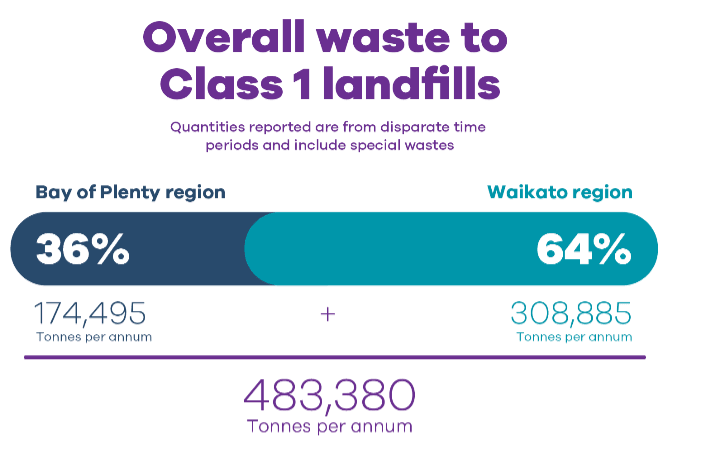
Key facts from Waikato Regional Waste Stocktake 2021[2]
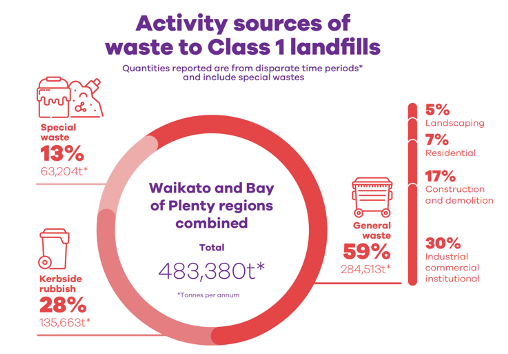
The Waikato and Bay of Plenty Regions send a combined total of483,380 tonnes of waste to landfill per year.
[1] Waikato-Waste-Prevention-Action-Plan-2020-2025.pdf (waikatoregion.govt.nz)
[2] Waikato and Bay of Plenty region waste and recycling stocktake 2021 (waikatoregion.govt.nz)
The main sources of waste in the regions are from kerbside, industrial, commercial and institutional sources and construction and demolition.
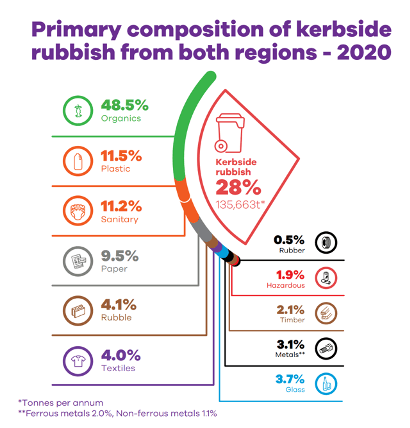
The highest volume of waste in kerbside collections is organic.
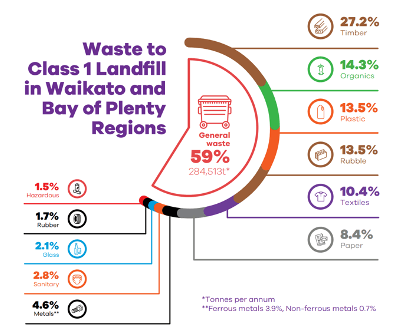
Of the general waste that is going to landfill (excluding kerbside collections), the highest volumes are from timber, organics and plastics and rubble.
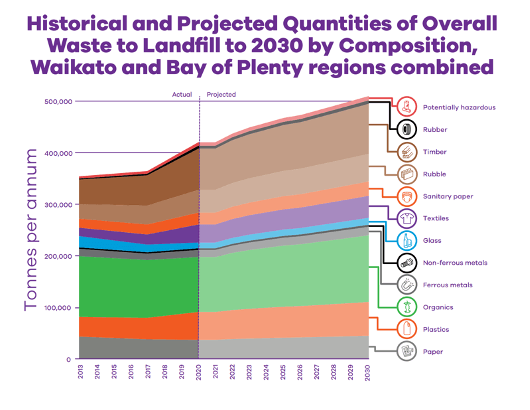
If nothing is done, waste to landfill is estimated to increase to over 500,000 tonnes by 2030
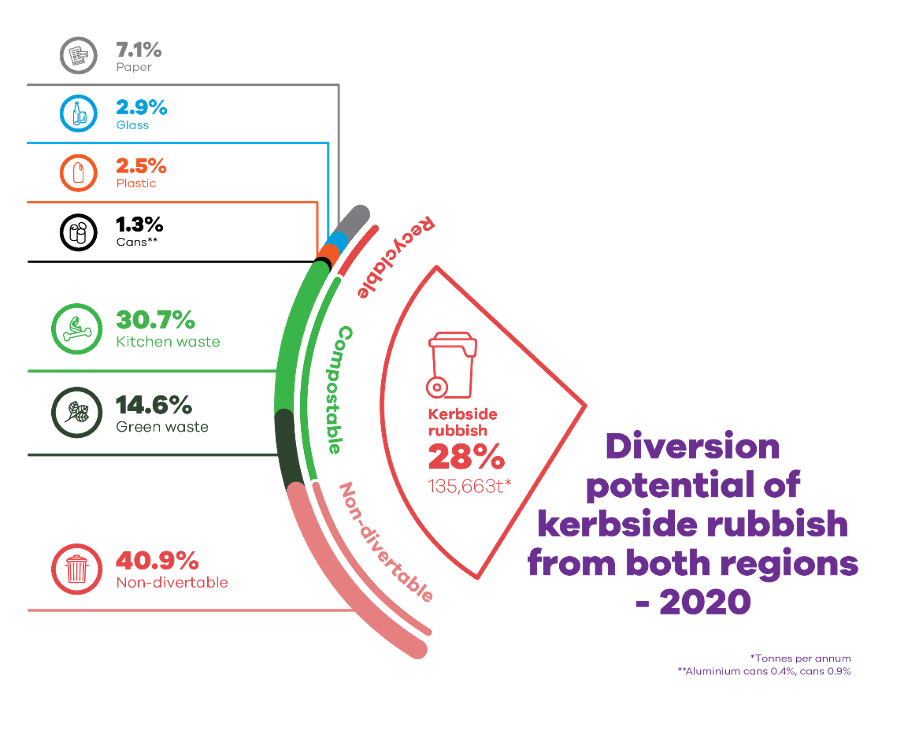
There is huge opportunity to prevent and reduce waste going to landfill. This stocktake estimates that 59.1% (80,138 tonnes per annum) of what is currently going to landfill from kerbside collection could be diverted.
An estimated 40.6% of general waste is divertible. This includes plasterboard and timber, showing there are gains to be made in construction and demolition waste diversion.