Progress Report
SDG 13
January 2023
Reduce carbon emissions by a minimum of 25% by 2030 (from 13.8 mega tonnes Co2e to 10.3 mega tonnes CO2e), on the path to net carbon zero by 2050.
ACHIEVING OUR TARGET
MEANS THAT:
Our people will be doing their part to transition to a cleaner, healthier, climate resilient region.
*We think we could reduce by more and will check this in two years time to see if we can make a more ambitious target
Global Picture
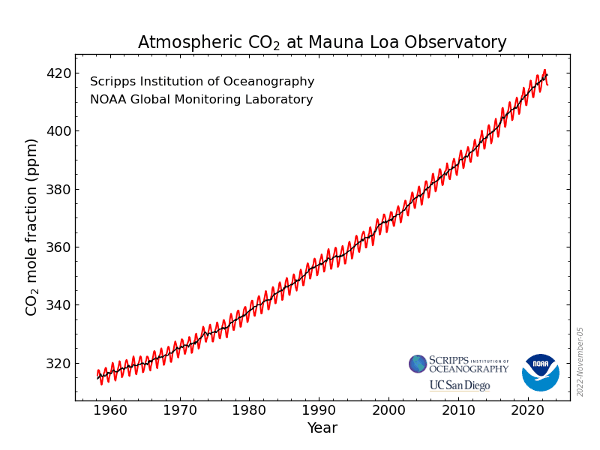
Despite the temporary reduction of CO2 emissions in 2020, global energy-related CO2 emissions rose by 6.0 per cent as demand for coal, oil and gas rebounded with the economy in 2021. As at 31 December 2021, a total of 123 countries had reported the adoption of national disaster risk reduction strategies, an increase from 55 countries in 2015. The number of countries with disaster risk reduction strategies that promote policy coherence with the Sustainable Development Goals and the Paris Agreement has reached 118, compared with only 44 in 2015. The COVID-19 crisis highlighted a further accelerated global effort and an approach to disaster risk reduction strategies that is more systemic and more multi-hazard in nature.
By April 2022, 193 parties (192 countries plus the European Union) had communicated their first nationally determined contribution under the United Nations Framework Convention on Climate Change and 13 parties had submitted their second nationally determined contribution. The nationally determined contributions attest that countries are articulating more quantified targets and indicators for adaptation and identifying links between adaptation and the Sustainable Development Goals and other frameworks.
At 31 March 2021, 125 of 154 developing countries were taking measures related to national adaptation plans and prioritizing formulation and implementation of national adaptation plans in their adaptation efforts. Six of the least developed countries (including three small island developing states) and an additional four small island developing States had completed a national adaptation plan.
More of the least developed countries had prepared a draft national adaptation plan and were on track to complete and submit it in line with the vision of all least developed countries having their national adaptation plan by 2021. [1]
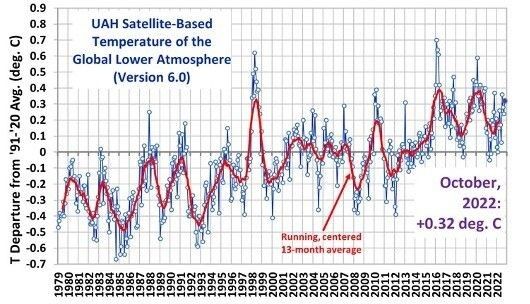
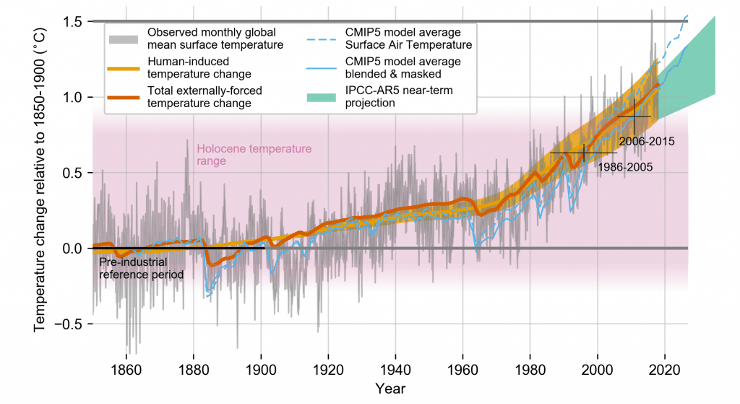
Instrumented global temperature anomaly records all show increases of about 1.1C since 1880, although the exact trend change across that timeframe differs slightly between land-based measures[2] and those collected since 1979 from satellites. Satellite measurement shows a linear warming trend since January, 1979 of +0.13 C/decade, with considerable internal variability.[3]
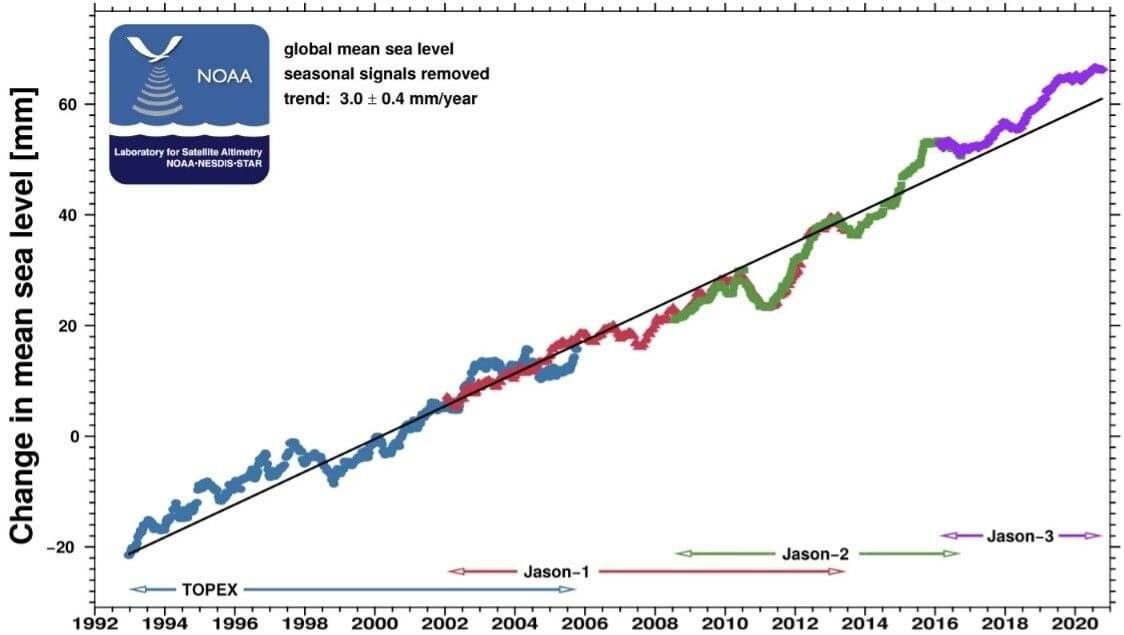
Instrumented global sea level data shows consistent upward trends, although sea level has been rising gradually since the end of the last glacial some 7-10,000 years ago. More recent satellite data does suggest an increase rate of rise[4], although this often varies due to local effects which can accelerate or offset rates of absolute sea level rise.
Aotearoa | New Zealand Picture
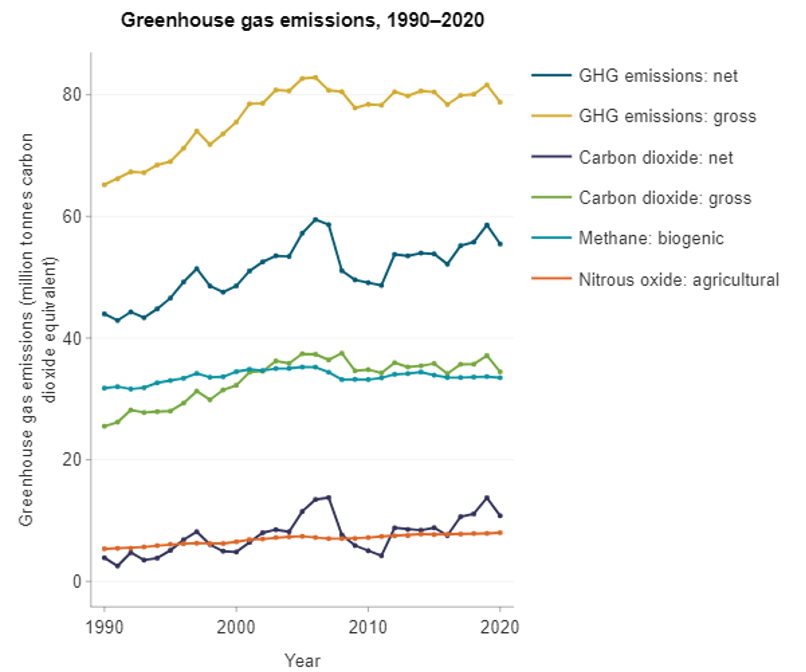
Data from Statistics New Zealand[1] shows that Aotearoa | New Zealand’s gross greenhouse gas (GHG) emissions have shown no sustained reductions compared with 2005. In 2020 Aotearoa | New Zealand’s gross greenhouse gas emissions were 78.8 million tonnes of CO2-e, 4.7 percent lower than 2005 and 20.8 percent higher than 1990. Emissions were 3.5 percent lower than 2019, primarily due to decreased emissions from road transport, which – in a year of covid lockdowns –saw the biggest annual decrease since the start of the time series (down 8.3 percent).
Gross GHG emissions were mainly made up of carbon dioxide (43.7 percent), methane (43.5 percent), and nitrous oxide (10.7 percent).
Gross carbon dioxide emissions were mainly produced by transport (38.0 percent), manufacturing industries and construction (19.1 percent), and public electricity and heat production (13.4 percent). In 2020 carbon dioxide emissions were up 35.1 percent from 1990, down 7.9 percent from 2005, and down 7.2 percent from 2019.
Gross methane emissions were mainly produced by livestock (88.9 percent). Overall, methane emissions were up 3.9 percent from 1990, down 6.2 percent from 2005, and down 0.7 percent from 2019. Methane emissions from livestock in 2020 were up 8.5 percent from 1990, down 2.0 percent from 2005, and down 0.4 percent from 2019. Livestock methane emissions in 2020 were mainly produced by cattle digestion (65.7 percent) and sheep digestion (27.2 percent).
Gross nitrous oxide emissions mostly came from agricultural soils (93.1 percent), approximately half (49.3 percent) of which was from urine and dung deposited by grazing animals. Overall, nitrous oxide emissions were up 46.1 percent from 1990, up 6.7 percent from 2005, and up 0.8 percent from 2019.
Nitrous oxide made up 20.3 percent of all agriculture emissions in 2020.
GHG emissions from transport were up 62.1 percent from 1990, up 0.9 percent from 2005, and down 10.1 percent from 2019. Transport emissions in 2020 were mainly made up of road vehicle emissions (91.2 percent) and domestic aviation (5.4 percent).
GHG emissions from manufacturing industries and construction were up 40.4 percent from 1990, up 31.4 percent from 2005, and down 11.3 percent from 2019.GHG emissions from public electricity and heat production were up 32.3 percent from 1990, down 48.7 percent from 2005, and up 9.5 percent from 2019.
Our net greenhouse gas emissions were 55.5 million tonnes, 26.1 percent higher than 1990 due to the underlying increase in gross emissions. The total amount of greenhouse gas emissions removed by forest land each year between 1990 and 2020 ranged from 19.1 million tonnes (in 2019) and 36.4 million tonnes (in 2007). In 2020 net GHG emissions were 5.3 percent lower than 2019, and the Land Use, Land-Use Change and Forestry (LULUCF) sector offset 29.6 percent of Aotearoa | New Zealand's gross emissions.
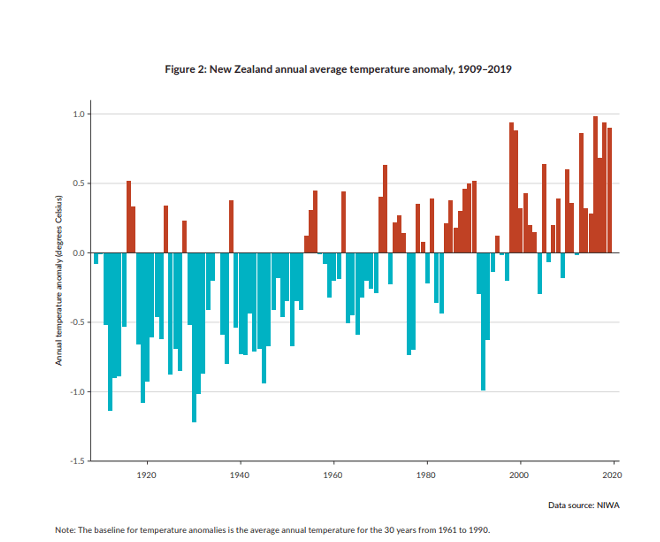
Overall, average temperatures are increasing In Aotearoa, the annual average temperature increased by 1.13 (± 0.27) degrees Celsius over the period 1909 to 2019. In the 22 years to 2019, Aotearoa had its five warmest years on record: in 1998, 1999, 2016, 2018, and 2019.
In the period from 1972 to 2019, 28 out of 30 monitored sites showed an increase in annual average temperature (the increasing trend was statistically very likely at 25 sites and likely at 3). The annual cumulative amount of warmth available has likely or very likely also increased at 27 of the 30 monitoring sites over the same period.[1]
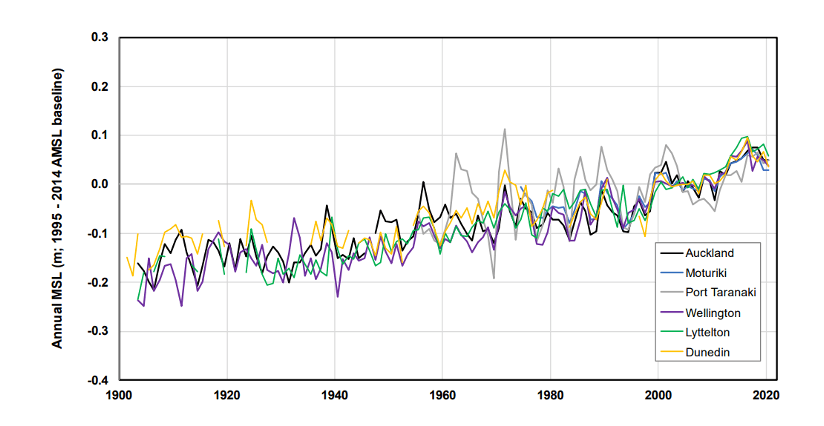
Greater data now exists on the localised effects of sea-level rise. Local sea-level change may be different from the global average, because winds and currents may change and because ice meltwater added to the oceans is not distributed evenly around the world. If the land is rising or falling, this also changes the sea level in that place. The term relative sea-level change describes the combined movement of both water and land. That is, even if sea level was constant there could still be changes in relative sea levels – rising land would produce a relative fall in sea level, while sinkingland would produce a relative rise in sea level. Across Aotearoa | New Zealand, the average relative sea-level rise for the 100 years up to 2015 was around 1.8 millimetres a year). Sea-level data from the 6 sites with tidal gauges in Aotearoa | New Zealand are shown below[1].
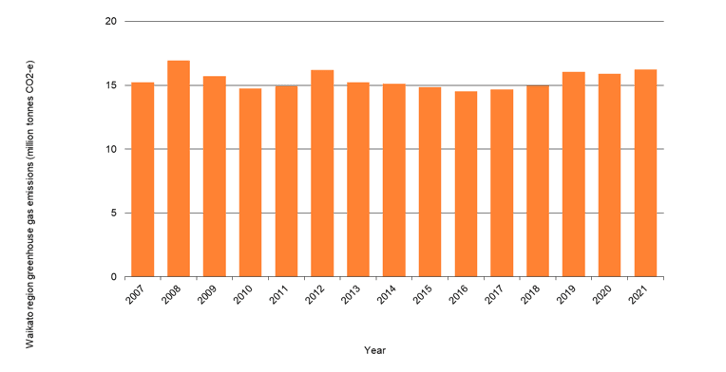
Waikato Picture
Waikato Progress Indicators
The WRC Roadmap[1] and the Waikato Progress Indicators note that:
Waikato region’s per capita net emissions are approximately 30 per cent higher than the national average (14.8 v 11.6 tonnes (MT) CO2e per capita).
Agricultural activities generate 69 per cent of all emissions (16% from transportation
13% from stationary energy, 1% from industry and 2% from waste)
Waikato region’s per capita agricultural emissions are more than twice the national average (18.2 v 7.9 tonnes CO2e per capita).
For reference, agriculture in the region emits 8,245kt of CO2e in 2019 and the region’s entire transport sector produced 1,034kt2
The forestry sector removes about 44 per cent of the Waikato’s total gross emissions, more than double the national (-11.7 v -4.9 tonnes CO2e per capita).
Most carbon sequestration comes from exotic forest.
The regional pathway for this depends on the combined effect of gross emission reductions and offsets (forestry, wetland conversation etc)
The Waikato Regional Council has developed a Coastal Inundation Tool to assist users to understand the susceptibility of coastal areas to coastal inundation due to tides, storms and projected sea-level rise at a regional scale. The tool is not intended to provide specific information that could be used to define actual coastal inundation hazards or minimum floor levels for specific properties. The tool uses a 'bathtub model' which usually results in an over estimation of inundation extents from extreme sea-levels. The tool can be accessed at Coastal inundation tool | Waikato Regional Council
Recently published research by NIWA uses a more dynamic approach and is likely to produce more accurate inundation scenario maps which could be required in areas with high potential population and asset exposure. [1]