Progress Report
SDG 1 and 2
January 2023
About one in six children live below the poverty line, by 2030 less than 1% will
ACHIEVING OUR TARGET
MEANS THAT:
Our children can thrive because none are hungry at school or cold at home. They can afford to participate in social, artistic, cultural and sporting activities.
None of our children are hungry
*this is the before-housing cost relative poverty measure, it is 1 in 4 once housing costs are accounted for.
SDG 1/2: No Poverty, Zero Hunger
Global Picture
Globally, the impact of the COVID-19 pandemic reversed the steady progress of poverty reduction over the past 25 years. This unprecedented reversal is being further exacerbated by rising inflation and the impacts of the war in Ukraine. It is estimated these combined crises will lead to an additional 75 million-95 million people living in extreme poverty in 2022 compared with pre-pandemic projections.
Owing to the COVID-19 pandemic, the global poverty rate increased sharply from 8.3 per cent in 2019 to 9.2 per cent in 2020, representing the first increase in extreme poverty since 1998 and the largest increase since 1990 and setting back poverty reduction by about three years.
In 2020, for the first time in two decades, the world’s share of workers living with their families below the international poverty line increased, from 6.7 per cent in 2019 to 7.2 per cent, meaning that an additional 8 million workers were pushed into poverty. Although the working poverty rate decreased slightly in 2021 to 6.9 per cent, it was still higher than the pre-pandemic rate.
Between 2014 and the onset of the pandemic, the number of people going hungry and suffering from food insecurity had been gradually rising. The COVID-19 crisis has pushed those rising rates even higher. The war in Ukraine is further disrupting global food supply chains and creating the biggest global food crisis since the Second World War. The COVID-19 crisis has also exacerbated all forms of malnutrition, particularly in children.
In 2020, between 720 and 811 million persons worldwide were suffering from hunger, as many as 161 million more than in 2019. Also in 2020, over 30 per cent – a staggering 2.4 billion people – were moderately or severely food-insecure, lacking regular access to adequate food. This represents an increase of almost 320 million people during just one year.[1]
Aotearoa | New Zealand Picture
Te Tai Waiora Wellbeing in Aotearoa | New Zealand 2022[2] reports that the proportion of people in material hardship has been declining since 2012, as measured by the Material Wellbeing Index (MWI). The MWI tracks the number of households who can afford a certain number of pre-defined items.
It is made up of 24 items, including the basics such as food and clothes, and some non-essentials that are commonly aspired to. There has been a decline in the number of households who have fewer than 12 of the 24 items and in the number who have fewer than six of the 24 items. However, rates of material hardship differ significantly across household types, with particularly high rates for sole parent households.
Our overall rate of hardship is quite similar to that in European countries, but the pattern is distinctive. Our hardship rates among those over 65 are quite low, while those among under-18s and people under the age of 65 living alone are both quite high. This partly reflects the relative levels of Aotearoa | New Zealand Superannuation to support provided to younger people, such as the Family Tax Credit. Material hardship is also higher among some groups of children, including children with disabilities, and children in households with someone who is disabled.
There has been a decline in rates of income poverty using a threshold anchored to the 2007 median income, both before and after housing costs. ‘Moving line’ measures have been flatter as improving economic conditions in recent years have lifted the median income and the moving line threshold with it. Poverty trends for children are similar, with rates decreasing on most measures. However, poverty rates are higher after housing costs and that the gap with poverty before housing costs is higher than it was 30 years ago. This pattern highlights the role of housing costs as a source of disadvantage for people with the lowest incomes.
Measures of child poverty have been declining in recent years, but trends in the fixed-line and moving-line poverty measures may diverge in future years, as median incomes are expected to grow faster than low incomes. Child poverty and material hardship rates continued to fall over the pandemic period, although Māori and Pacific children continue to experience much higher levels of material hardship.
These recent declines are likely to reflect increases in income at the bottom of the distribution relative to the middle. We have also seen much higher growth in the incomes of both working and beneficiary households with children in recent years, compared to households without children, perhaps reflecting changes in Working for Families.
NZ-wide child poverty indicators (DPMC 2022) show:
Positive medium term (2007-2021) and a mixed short-term (2019-2021) picture for housing affordability and quality, food insecurity, school attendance and potentially avoidable hospitalisations
Ministry of Health Data[3] Indicates
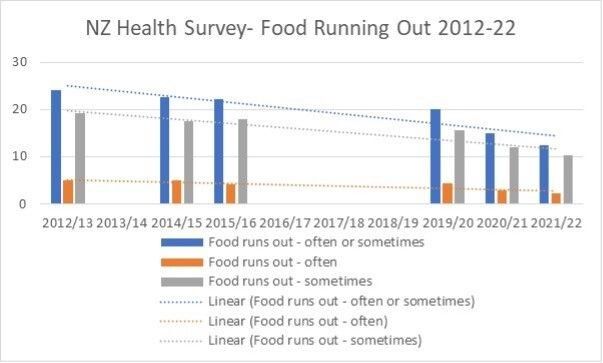
12.5% of children lived in households where food runs out sometimes or often in 2021/22. This is similar to the previous year, but down from 20.0% in 2019/20.
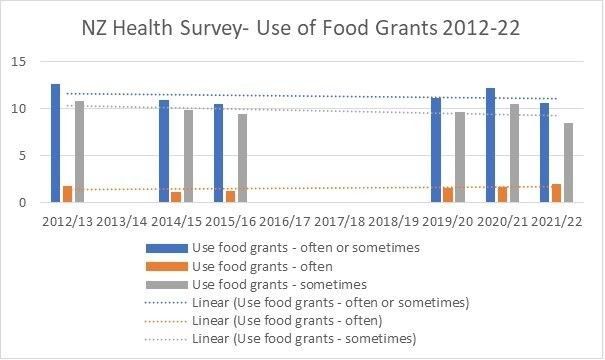
10.6% of children lived in households that sometimes or often use foods banks or grants in 2021/22, which is similar to previous years.
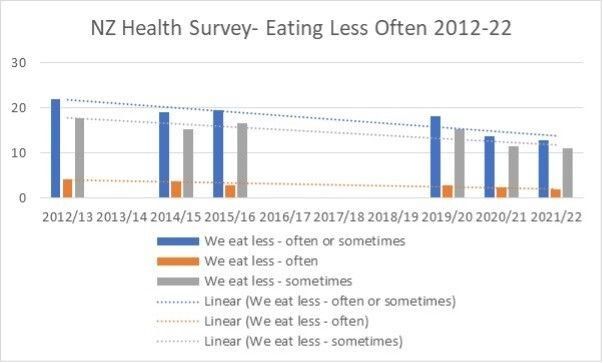
12.9% of children lived in households where they sometimes or often eat less because of lack of money for food in 2021/22. This is similar to the previous year, but down from 18.2% in 2019/20.
Children living in households in the most deprived areas were 4-6 times as likely to experience food insecurity as children living in the least deprived areas, after adjusting for differences in age, gender and ethnicity.
o In 2021/22, half of adults (49.8%) met the fruit intake recommendation (2+ servings per day).
10.4% of adults met the vegetable intake recommendation (5 to 5.5 servings).
73.9% of children (2–14 years) met the fruit intake recommendation (1 to 2 servings).
6.4% of children (2–14 years) met the vegetable intake recommendation (2.5 to 5.5 servings)
In 2020/21[4]
Approximately 322,900 children (28.1%) were living in after-housing-costs income poverty, on the 60% of equivalised household median, moving-line measure
Approximately 236,900 children (20.6%) were living in income poverty, on the related 50% measure
Approximately 150,400 children (13.1%) were living in severe income poverty, on the 40% or less measure.
Material hardship rates for Māori and especially Pacific children are far above national rates overall: around one in five Māori children (20.2% of 298,000 or 60,300 children) live in material hardship, and around than one in four Pacific children (24% of 141,500 children or 34,000) compared to just over one in ten children overall (11%).
The material hardship rates for disabled children is one in five (20.5% of126,800 children).
Disabled children have over double the rate of severe material hardship to non-disabled children (10.3% and 4.2% respectively), while children in households with a disabled member have four times the rate of severe material hardship to children in a non-disabled household (10.3% and 2.5% respectively).
Waikato Picture
Specific regional data for hunger and poverty is limited, however the information available shows persistent deprivation, poverty and hunger are significant issues in parts of the region. COVID-19 and inflation has particularly affected poverty and lack of access to good food.
Data collated by ST Vincent de Paul indicates that across the various food rescue and emergency food providers in Hamilton alone provide approximately 12,000 food parcels and meals per week- or about 1,700 per day. If we assume there are about 50,000 households in the Hamilton area (Figure.nz) that would indicate that about 3.5% of the city’s households are unable to access adequate supplies of food from the usual market-based sources.
Research by Ngati Haua in 2021 indicated that 2.4% of all meals in New Zaland (equivalent to 130 million of the 5 billion meals served per year) have to be funded by government and charity. Their 2021 research concluded that this is growing at between 20 and 100% per annum.
Their research found that low-income whanau that do not access charitable food sources make up 20% of all homes in New Zealand- 300,000 households or 1.2 million people. A very high proportion are Māori and Pasifika. They also found that of the 11,000 products on supermarket shelves, just 5% are truly affordable and many of these are of low nutritional quality.
While it’s not possible to make exact extrapolations from this data to the Waikato, based on the Waikato being just under 10% of the nation’s population, and allowing for socio-economic factors, a reasonable estate would be that some 33,000 households Iin the region have their nutritional options limited by high food prices.