Progress Report
SDGs 4, 8 and 10
January 2023
Reduce the number of young people (aged 15-24) in the Waikato who are not in employment, education or training (NEET) from 12.6% in 2019 to less than 5% by 2030.
ACHIEVING OUR TARGET
MEANS THAT:
All of our young people are engaged and productive, they are learning or learning a livelihood, their mana is enhanced, and they are on a positive pathway to have many life options.
Our employers can find motivated staff with the knowledge and skills they need to get started, and the means to learn more.
*In 2019, the overall NEET rate for the Waikato is 12.6%, but the rate is 19.3% for Maori and 16.8% for Pasifika.
Global Picture
The COVID-19 outbreak has caused a global education crisis. Most education systems in the world have been severely affected by education disruptions and have faced unprecedented challenges. It is estimated that 147 million children missed more than half of their in-class instruction over the past two years. This generation of children could lose a combined total of $17 trillion in lifetime earnings in present value. The participation rate in organized learning one year before the official primary entry age rose steadily in the years before the COVID-19 pandemic, from 69 per cent in 2010 to 75 per cent in 2020 but with considerable variation between countries (with the rate ranging from a figure as low as 13 per cent to nearly 100 per cent).
In 2020, the COVID-19 pandemic unleashed the worst economic crisis in decades, with a severely damaging impact on working time and income. Although the global economy started to rebound in 2021, waves of spreading COVID-19 infections together with rising inflation, major supply chain disruptions, policy uncertainties and unsustainable debt of developing countries caused the global economy to slow down at the end of 2021. The conflict in Ukraine is expected to seriously set back global economic growth in 2022.
Following an increase of about 1.4 per cent in 2019, global real GDP per capita decreased sharply by 4.4 per cent in 2020. Global real GDP per capita is estimated to have rebounded at a growth rate of 4.4 per cent in 2021 and is projected to increase again by 3.0 per cent in 2022 and 2.5 per cent in 2023 based on pre-war estimations. The war in Ukraine is likely to downgrade global growth. The real GDP of least developed countries had increased by 5.0 per cent in 2019 but showed no growth in 2020 because of the disruption caused by the pandemic.[1]
The proportion of the world’s youth not in education, employment or training (NEET) is now at its highest level since 2005. The NEET rate had remained unchanged from 2015 to 2019 at 21.8 per cent but increased to 23.3 per cent in 2020, representing an addition of almost 20 million youth. Although youth represented only 13 per cent of total employment before the crisis, they made up 34.2 per cent of the 2020 decline in employment. Meanwhile, both technical and vocational education and on-the-job training suffered massive disruption, forcing many young people to quit their studies.[2]
Prior to the outbreak of the COVID-19 pandemic, more than three fifths of countries with available data saw higher growth in household expenditure or income per capita among the bottom 40 per cent of the population than the national average. The pandemic is threatening to reverse this trend. In 2020 many countries saw declines in growth among the bottom 40 per cent of greater magnitude than the national average.[3]
Aotearoa | New Zealand Picture
Te Tai Waiora Wellbeing in Aotearoa | New Zealand 2022[4] reports that the skill and qualification level of our adult population is strong compared to people in other countries, reflecting historically high levels of school achievement and the immigration of highly educated people. On average, our 15-year-olds rank relatively highly in reading and science compared to their counterparts in other countries as measured by the Programme for International Student Assessment (PISA), although our ranking in maths has fallen significantly in the 10 years or so. Of more concern, however, is that our achievement scores have been declining in all three subjects.
More positively, the number of young people leaving school with qualifications has been improving over time, perhaps reflecting the broader curriculum of our National Certificate of Educational Achievement (NCEA). There is a big gap between the highest-achieving and lowest-achieving students by OECD standards. While the gap appears to have closed slightly over time, this is only because achievement of the advantaged group has dropped by more than the disadvantaged group (levelling down rather than up).
There is a range of competing theories for the declining trend in school educational achievement. Given that many OECD countries have experienced a similar trend, explanations that resonate across countries are appealing. 30 A potential cross-country explanation is around the extent to which teaching methods have supported the effective use of the internet and social media in classrooms, alongside their potential to distract young people from studies and other learning opportunities.
Negative trends in youth mental health may also play a role. However, it is possible that different factors are driving the downward trend in different countries. An important factor in Aotearoa | New Zealand may be the steady decline in school attendance rates over the past decade. There is a strong relationship between attendance and student attainment to the extent that every absent day matters. Attendance is particularly important for students with the highest levels of socioeconomic deprivation and attendance has been falling the most for schools that serve those communities.
There are several other potential explanations for declining educational achievement, including changes in the curriculum that decreased emphasis on reading, writing and arithmetic, the move away from external examination under NCEA, and social inequality or disadvantage.
The evidence is not conclusive and is likely to be a mix of factors and different combinations of factors for different groups.
From early childhood to adult education, Education at a Glance 2021[5] paints an overall picture of the comparative strengths of the Aotearoa | New Zealand education system.
Aotearoa | New Zealand sits above the OECD average in terms of our rates of 3–5-year-olds who were enrolled in education in 2019
A higher percentage of Aotearoa | New Zealand young adults had an upper secondary qualification in 2020 than the OECD average of 40%
Over 80% of Aotearoa | New Zealand adults aged 25-64 years old had at least an upper secondary qualification in 2020, above the OECD average
Aotearoa | New Zealand had a below average share of 18-24 year-olds that were not in education, employment or training in 2020
In 2019 international students made up about 20% of all diploma level and above students in Aotearoa | New Zealand, above the OECD average of 6%
o Employment rates in Aotearoa | New Zealand for diploma-level and above educated young adults were higher than the OECD average in 2020
Aotearoa | New Zealand has a higher percentage of female teachers at each level of education than the OECD average, and higher percentages of both teachers under the age of 30 and teachers aged 50 and above compared to the OECD averages in 2019
Aotearoa | New Zealand spent 6.2% of our GDP on education in 2018, ranking us 4th within the OECD
Employment
Aotearoa | New Zealand has consistently had one of the highest employment rates in the OECD since at least the turn of the century. We also have high levels of job satisfaction in most industries. Employment matters as work not only provides income but also contributes to social connection and self-identity. Research into subjective wellbeing shows that losing a job has significant negative effects on health and happiness beyond the loss of income, while being in satisfying work promotes overall life satisfaction. Aotearoa | New Zealand also has the highest rate of voluntary work in the OECD.
Unemployment fell significantly over the 1990s and has stayed relatively low this century, apart from an upward spike during the Global Financial Crisis. While there was a sharp increase in unemployment in the second half of 2020, this increase was less severe than that in most other countries, and we returned quickly to pre-pandemic levels, if not lower. Employment and unemployment rates have recovered for all ethnicities, genders and age groups, although pre-pandemic disparities remain.
A contrast to this generally positive picture is the number of young people not in employment, education or training (NEET), where our performance is middling by international standards. NEET rates are also higher among Māori and Pacific peoples. The young people that are most at risk of being NEET or experiencing limited unemployment more broadly, over long periods of time are those experiencing intergenerational benefit dependency, those who have had contact with Oranga Tamariki and/or the justice system, young parents and those with no or low qualifications.
GDP Per Capita
From the late-1960s to the mid-1990s, real GDP per capita grew in Aotearoa | New Zealand, but at a slower rate than in other high-income OECD countries. Aotearoa | New Zealand reversed its relative GDP per capita decline in the early 1990s, but we still did not catch up to the levels of other high-income countries. This is because, even though we have lots of people in work (labour utilisation), our workers produce less per hour than workers in other countries (productivity growth).
However, our incomes have grown more than would be expected from our GDP performance. Another measure of aggregate incomes is real gross domestic income (GDI). In contrast with GDP, GDI also captures increases in income from changes in our terms of trade or the price of our exports relative to our imports. Since the early-2000s, Aotearoa | New Zealand’s per capita real income has grown faster than its per capita GDP – reflecting a rising terms of trade. This has been driven largely by increases in export prices, particularly – but not only – dairy prices. It has also been influenced by a change in the composition of imports before the early 2000s and declines in import prices since the Global Financial Crisis.
Therefore, looking only at GDP under-states our income growth since the turn of the century. That may partly explain the puzzle that Aotearoa | New Zealand performs strongly on many wellbeing-type indices, including the United Nations Human Development Index64 and the OECD Better Life Index, in comparison to our relatively lower GDP per capita. We have more income to spend on things that support our wellbeing than implied by the GDP measure.
However, our improving terms of trade have still not allowed us to reach the income levels of the higher-income OECD countries. In Aotearoa | New Zealand, labour productivity has been the main source of income growth, reinforcing the importance of lifting productivity to provide sustainable increases in material living standards for both current and future generations.
Income and consumption
Income and consumption have grown significantly over time, and our material standard of living is far higher than in the past. After hitting a low point in 1994, average household disposable income has been climbing steadily. Aggregate measures of consumption have also increased steadily in recent years. Household income remained resilient through the pandemic, and while there were declines in consumption during lockdown periods, it rapidly recovered.
Despite the growth in incomes since the mid-1990s, Aotearoa | New Zealand is still below the median country for average household incomes. In contrast, we are above the median country for median household wealth. This masks significant complexity in the distribution of income, consumption and wealth.
Income inequality as measured by the Gini coefficient of annual household disposable income appears to have increased from the 1980s to the 1990s and to have been flat since then but data limitations make it hard to be sure.
Income inequality after accounting for housing costs appears higher, but both have been broadly flat since the late 1990s. Aotearoa | New Zealand is a little above the middle of the 36 OECD countries with data on this topic, with 24 countries having lower inequality as measured this way and 11 having higher inequality. However, these comparisons are subject to uncertainty due to data limitations.
Headline income inequality is influenced by many factors, including household and family composition, tax and transfer rates, and housing costs. Among these various factors, the distribution of labour market earnings is one of the most important.
Our labour markets do less to create inequality than in most other OECD countries because the gap between low-wage and high-wage employees is smaller. In addition to high employment and a low unemployment rate, earnings inequality among those employed is low by OECD standards. Among full-time employees, those at the 90th percentile earn less than three times as much as employees at the 10th percentile. This ratio is below the OECD median and near the lowest ratio, which in 2020 could be found in Sweden. This relativity narrow spread of earnings is in part because the private returns to higher education in Aotearoa | New Zealand are lower than in other OECD countries. This counteracts to some extent intergenerational transmission of advantage and disadvantage via education
Point-in-time wealth inequality is much higher than income inequality, with more than half of total wealth held by 10% of people, and about half of people having no or very low net wealth. The available data is similar for other countries across the OECD, with our level of wealth inequality appearing to be a little above that of the typical OECD country.
A robust time series of wealth inequality is only available back to 2015, and between then and 2021 the overall distribution of wealth appears largely unchanged. As with income, point-in-time inequality partly reflects lifecycle patterns – older people tend to have more wealth than younger people, on average. There is also substantial variation in wealth within each age band, suggesting that lifecycle patterns only explain part of the wide variation in cross-sectional wealth. The gap between young and old also appears to have widened since 2001
[1] Goal 4 | Department of Economic and Social Affairs (un.org)
[2] Goal 8 | Department of Economic and Social Affairs (un.org)
[3] Goal 10 | Department of Economic and Social Affairs (un.org)
[4] Te Tai Waiora: Wellbeing in Aotearoa Aotearoa | New Zealand 2022 (treasury.govt.nz). Detailed references are not provided here.
Waikato Picture
Waikato Progress Indicators
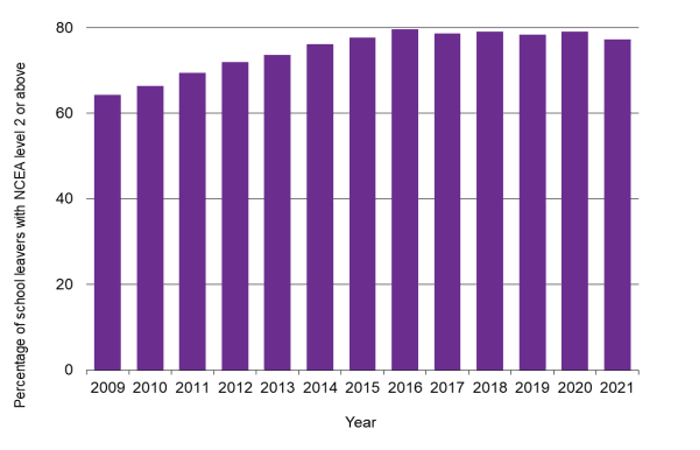
Over the period 2009 to 2016, there was a strong upward trend in the percentage of school leavers with NCEA level 2 or above, and this measure remained high in 2021 relative to historical levels despite disruptions due to the COVID-19 pandemic.
The Ministry of Education and the Aotearoa | New Zealand Qualifications Authority (NZQA) introduced a range of responses to NCEA to support students during the pandemic. In 2021 this included additional supports in the Auckland, Tai Tokerau and Waikato regions in recognition of a higher degree of disruption in these regions.
A higher percentage of females than males achieve NCEA level 2 or above, and educational attainment remains lower for Māori school leavers compared to other ethnic groups at the regional and national level.
There is considerable variation throughout the Waikato region for this indicator. In 2021, the percentage of school leavers with NCEA level 2 or above ranged from a low of around 62 per cent in the Waitomo District up to 82 per cent in the Hauraki District. These local level figures can change considerably from year to year.
According to latest results from the Programme for International Student Assessment (PISA), Aotearoa | New Zealand’s reading, mathematical and science literacy scores were all above the OECD average for PISA 2018. There was no significant difference in Aotearoa | New Zealand’s performance in reading, mathematical and science literacy from PISA 2015, however the long-term trend shows a decline in scores.
Latest results from the Trends in International Mathematics and Science Study (TIMSS) show that for Aotearoa | New Zealand’s Year 5 students in 2018/19:
Average mathematics achievement was similar to 2014 but higher than 1994, and average science achievement remained similar to prior years.
Average mathematics achievement was significantly higher than 15 countries but lower than 38 countries. Average science achievement was significantly higher than 23 countries but lower than 31 countries.
Waikato is Aotearoa | New Zealand’s fourth-largest region, making up approximately 8.9 percent of Aotearoa | New Zealand’s GDP in 2021.
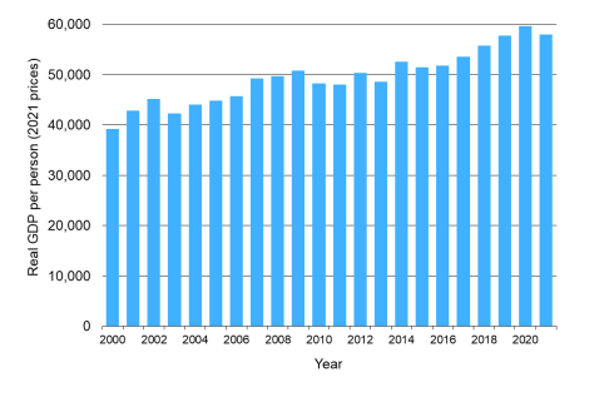
Waikato GDP per person is typically around 10-15 per cent lower than the national average, largely due to the influence of higher average GDP per person in Auckland and Wellington.
Regional GDP per person slumped in the 2010 to 2013 period and subsequently recovered up to 2020. Data for 2021 shows a dip in real GDP per capita in the Waikato region following economic disruptions from the COVID-19 pandemic.
Between 2020 and 2021, the Waikato region’s GDP increased 2.4 percent compared to population growth of 1.9 percent and inflation of 3.3 percent, resulting in a real per capita GDP decline of approximately -2.7 percent. By comparison, overall national GDP increased by 0.8 per cent and real GDP per capita declined by approximately -3.7 percent.
According to Ministry of Business, Innovation and Employment (MBIE) modelling of Territorial Authority GDP, the strongest growth in per capita nominal GDP in the Waikato region over the most recently available full-year period 2018-19 was in Hamilton City (7.6 percent) followed by Matamata-Piako (6.0 percent) and Hauraki District (5.6 percent).
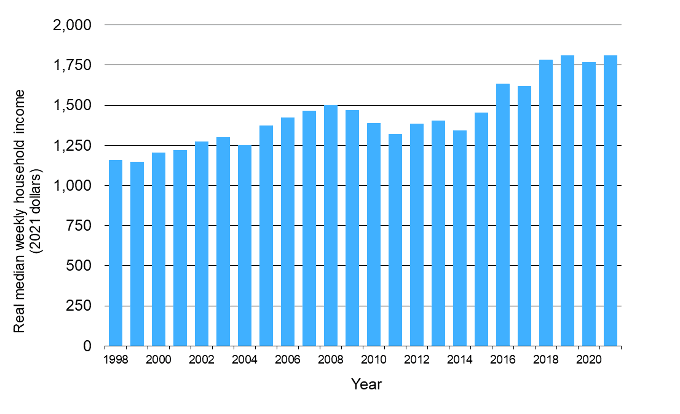
Median weekly household income in the Waikato region in 2021 was around $68 below the national average. Weekly household income in the Waikato region was $1,812 in June 2021 compared to $1,880 for Aotearoa | New Zealand overall.
Median weekly household income in the Waikato region increased in 2021 following a drop in 2020.
In Aotearoa | New Zealand, the average household net-adjusted disposable income per capita is US$25,074 a year, lower than the OECD average of US$33,604.
[1] The Gini coefficient is based on the comparison of cumulative proportions of the population against cumulative proportions of income they receive, and it ranges between 0 in the case of perfect equality and 1 in the case of perfect inequality.
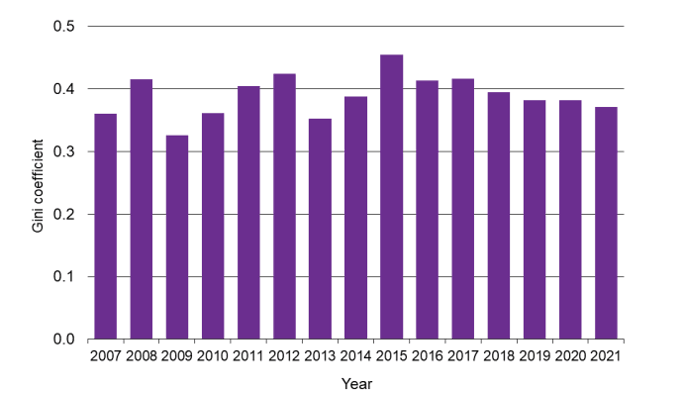
The Waikato regional level of income inequality, measured by the Gini coefficient[1], in 2021 was similar to 2007.
The household income inequality indicator for the Waikato region was also similar or slightly lower than the Aotearoa | New Zealand average for much of the period between 2007 and 2021.
According to a 2017 Ministry of Social Development report on income inequality and hardship indicator trends for Aotearoa | New Zealand overall (Perry 2017, page 87), there was a steep rise in the Gini coefficient and other income inequality indicators from the late 1980s to the early 1990s followed by a relative flatness of the Gini trend line from the mid-1990s. Perry identifies some fluctuations in household income inequality since the mid-1990s but no evidence of any sustained rise or fall in the Gini coefficient or other income inequality indicators over this period (Perry 2017, page 85).
An alternative measure of income inequality is the P80/P20 ratio. This is calculated as the ratio of household income at the 80th percentile (i.e. 20% below the wealthiest household) to household income at the 20th percentile (i.e. 20% above the lowest income household), after adjusting for household size and composition. As household income inequality increases, so does the P80/P20 ratio. Calculations using data from the Aotearoa | New Zealand Household Economic Survey (HES) show that income inequality in the Waikato region using the P80/P20 measure is at similar level to 2007 level and similar to the national average
According to the OECD Better Life Index website, Aotearoa | New Zealand is ranked 23rd out of 35 OECD countries in relation to its measured level of social inequality.