Progress Report
SDG 6
January 2023
Increase the number of swimmable rivers and lakes in the Waikato from 30% (rivers) and 73% (lakes) in 2019 to both waterbody types achieving more than 80% by 2030.
ACHIEVING OUR TARGET
MEANS THAT:
Our waterways contribute to the health of our regions, like the veins of a healthy body.
“I am the river, and the river is me. If the river is unwell, I am unwell”
* Swimmable - in this context “swimmable” for rivers is defined as per the E. coli Attribute table in the NPSFM (2014; amended 2017). “Swimmable” for lakes is defined as per the planktonic cyanobacteria attribute table in NPSFM (2017).
Global Picture
Between 2015 and 2020, the population using safely managed drinking water services increased from 70 per cent to 74 per cent, the population with safely managed sanitation increased from 47 per cent to 54 per cent and the population with access to handwashing facilities with soap and water in the home increased from 67 per cent to 71 per cent. Rates of progress for these basic services would need to quadruple for universal coverage to be reached by 2030.
Assessment of rivers, lakes and aquifers in 97 countries in 2020 shows that 60 per cent of water bodies assessed have good water quality. Of the 76,000 water bodies that were reported on in 2020, only 1 per cent were from the poorest countries.
Over the past 300 years, wetland ecosystems have experienced an 85 per cent loss in extent despite the very high value goods and services that they provide. Additionally, the extent of surface water bodies, including lakes, rivers, and reservoirs, is rapidly changing across the entire planet, with one in five river basins experiencing high - above natural - fluctuations in surface water during the last five years. Population growth, changes to land cover and land use and climate change are key drivers of these changes to freshwater ecosystems.[1]
Aotearoa | New Zealand Picture
Te Tai Waiora Wellbeing in Aotearoa | New Zealand 2022[4] reports that the skill and qualification level of our adult population is strong compared to people in other countries, reflecting historically high levels of school achievement and the immigration of highly educated people. On average, our 15-year-olds rank relatively highly in reading and science compared to their counterparts in other countries as measured by the Programme for International Student Assessment (PISA), although our ranking in maths has fallen significantly in the 10 years or so. Of more concern, however, is that our achievement scores have been declining in all three subjects.
According to the MfE Environment-Aotearoa 2022 report[2], many of our lakes and rivers have unnaturally high levels of nutrients due to leaching and run-off from urban or agricultural sources. We used both measured and modelled data to assess the water quality of our rivers and lakes. Computer models estimate that of 3,813 lakes in Aotearoa, 46 percent rated poor or very poor in terms of nutrient enrichment (as measured by Trophic Level Index) between 2016 and 2020.
Modelled data for 2016–20 indicated risk of environmental impairment (based on comparison with reference conditions) from at least one form of phosphorus (total phosphorus or dissolved reactive phosphorus) in 64 percent of the river length of Aotearoa, and 69 percent for at least one form of nitrogen (total nitrogen, nitratenitrite-nitrogen, or ammoniacal nitrogen).
Water quality varies according to how much the catchment has been modified. Freshwater river quality tends to be poorest near areas with a high proportion of human modification and is highest quality in areas that have had the least modification. Monitored sites with higher proportions of human modified land cover in the upstream catchment area had higher concentrations of all forms of nitrogen and phosphorus, compared to sites with lower proportions of human modified land cover for 2016–20.
Between 2001 and 2020, trends were improving for nitrate-nitrite-nitrogen at 38 percent of monitoring sites, and for ammoniacal nitrogen at 61 percent of monitoring sites. (In this and the following section, improving and worsening trends include both likely and very likely statistical trends. See relevant indicators for trend assessment detail.) For the same period, 67 percent of sites had improving trends for dissolved reactive phosphorus.
Freshwater systems are complex, and nutrients can move at different speeds through catchments, so it is difficult to understand the causes of these trends (McDowell et al, 2021; MfE & Stats NZ, 2020b). For lake water quality there was insufficient data to determine 20-year trends across the network of monitored lakes.
Computer models for 2016–20 estimated risk of environmental impairment (based on comparison with reference conditions) for turbidity in 37 percent of the river length of Aotearoa, and 9 percent for visual clarity. For the period 2001 to 2020, clarity and turbidity trends were improving at over half of monitoring sites and worsening at approximately one third. (See indicator: River water quality: clarity and turbidity.)
A high macroinvertebrate community index (MCI) score indicates a high level of river health. Of the river length of Aotearoa, computer models estimated 17 percent had MCI scores that may indicate severe organic pollution or nutrient enrichment between 2016 and 2020. Only seven percent had modelled MCI scores indicative of pristine conditions with almost no organic pollution or nutrient enrichment. MCI scores worsened across 56 percent of monitoring sites between 2001 and 2020. (See indicator: River water quality: macroinvertebrate community index.)
The quality of our groundwater is mixed but improving in many places. For nutrients, between 2009 and 2018 more groundwater monitoring sites had improving trends than worsening. However, for E. coli, half of groundwater monitoring sites showed a worsening trend with only 18 percent improving over this period. For further discussion of groundwater see Our freshwater 2020 and indicator: Groundwater quality.
Waikato Picture
Waikato Progress Indicators
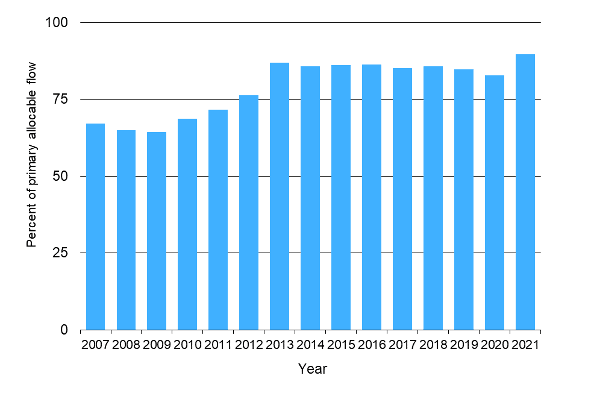
From 2009 to 2013, the percentage of water allocated through resource consents of the total water available to be allocated for use has risen substantially, and since then has stayed relatively constant at 85-87% of the primary allocable flow (as prescribed by Table 3-5 of the Regional Plan). The water use indicator grew from 83% to 90% in 2021 because of the Watercare consent being granted.
River water quality for ecological health is generally good across the region. However, in areas where land use is more intensive, water quality for ecological health is poorer (for example, Hauraki and the lowland tributaries of the Waikato River). This is mainly because of the greater intensity of land use in the lowland parts of the Waikato region.
Water quality in the Waikato River is much better than it was in the 1950s. Urban and industrial wastewater treatment has improved considerably. But over the past twenty years, levels of nitrogen in the river have risen, probably because of land use changes over recent decades.
Key freshwater statistics:
70% of rivers in the region have satisfactory overall quality (E.Coli), no change from 2003
30% of rivers in the region unsatisfactory overall quality (E.Coli), no change from 2003
63.6% of waterways in the region unsatisfactory (baseflow clarity), 6.88% excellent
80.87% of waterways in the region are unsatisfactory for swimmability only 2.61% excellent
Aggregate Waikato freshwater quality for ecological health is generally good, where land use is more intensive, water quality for ecological health is poorer
Water quality in the Waikato River better than it was in the 1950s, however nitrogen levels have increased