Sustainable Development Goals 14
WWP TARGET:
Maintain or enhance the mauri of our coastal and marine waters to ensure healthy ecosystems so that they can also enjoy mahinga kai and swimming.
ACHIEVING OUR TARGET MEANS THAT:
Our coastal ecosystems are healthy reflecting the mauri from the mountains to the sea and provide for the enjoyment by people for swimming, collecting food and other activities.
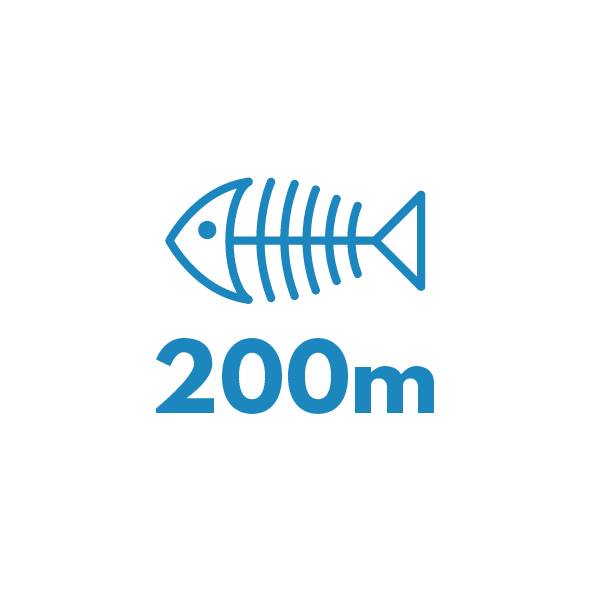
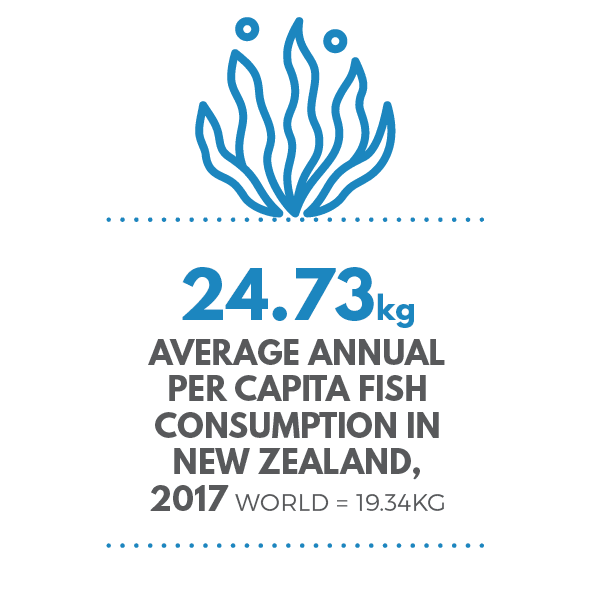
Most global marine ecosystems now show the influence of human actions, with coastal marine ecosystems showing both large historical losses of extent and condition as well as rapid ongoing declines.
Global production (in tonnes) of fish and seafood every year, from a combination of wild fish catch and fish farming
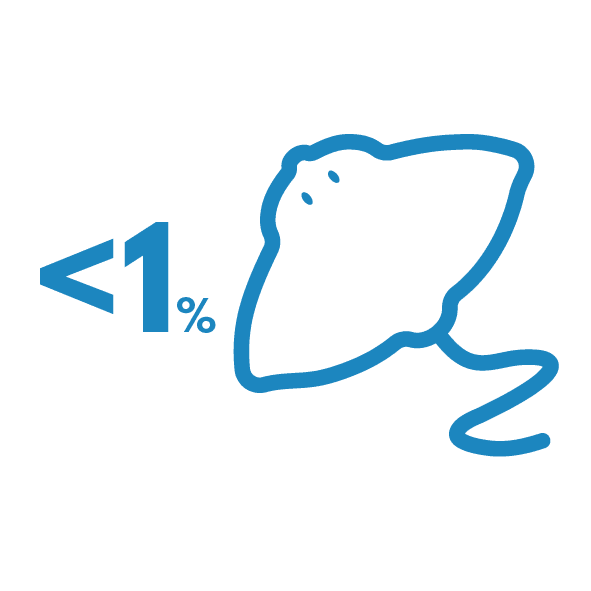
of the ocean is fully or highly protected from fishing impacts

of the High Seas is in implemented and fully / highly protected areas
The marine environment is affected by a range of individual and cumulative pressures. Our activities place pressure through commercial and recreational fishing, aquaculture, extraction of natural resources, non-indigenous species, and coastal development.
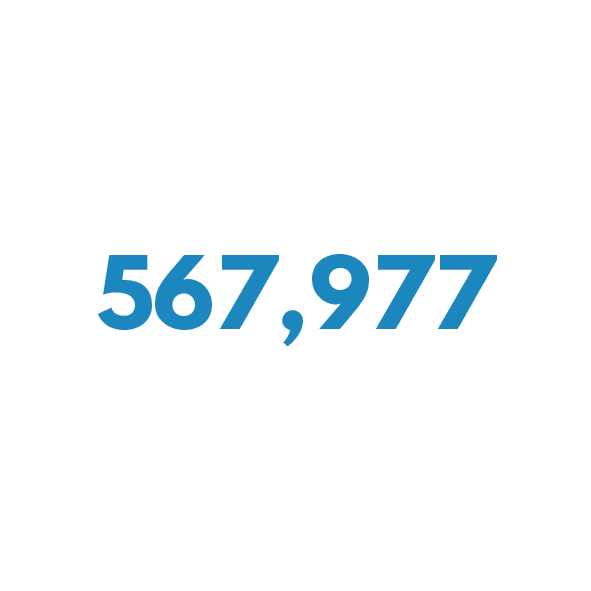
tonnes of wild fish caught in New Zealand
49,850 in 1960

tonnes of aquatic organisms from aquaculture in 2018
2,800 in 1960
(12,792 km2) of our territorial sea is legally protected marine reserves (1974 = 0%)
Our coasts are threatened by loss of natural character and biodiversity, and degraded water and sediment quality. Most monitored sites are moderately healthy, and at most sites there were only slight changes in estuarine ecosystem health between 2012 and 2020.
Average Trait - Based Index (TBI) for estuarine areas, 2020 (>0.4 = good) 2012 = 0.4

Ha of coastal areas protected by Taiapure, Rohe Moana and Matiatia customary provisions

of the Waikato's Coastal Marine Area is marine reserve
LIFE BELOW WATER INSIGHTS
Tell me more about this
i. An adequate description of the dataset
This report presents Waikato regional and territorial local authority results from a survey undertaken in parallel with the 2022 Quality of Life Survey (a collaboration between nine New Zealand councils including Hamilton).
ii. The source(s) of information
Waikato Regional Council
https://www.waikatoregion.govt.nz/services/publications/tr202249/
iii. The date when the data was collected and the expected update frequency
November 2022
iv. Any use or publication restrictions, including cultural restrictions
None
v. A contact person or organisation
www.bps.waikatoregion.govt.nz/online-services/new/RequestForService/step/1?Subject=Policies,planningandstrategies
vi. Any quality/data health warnings
No
Tell me more about this
i. An adequate description of the dataset
A set of indicators which measure the Waikato region’s progress by identifying our current situation and trends across each of 32 key economic, environmental and social aspects.
ii. The source(s) of information
Waikato Progress Indicators:
https://public.tableau.com/app/profile/waikato.regional.council/viz/WaikatoProgressIndicatorsDashboard_16862300344780/INTRODUCTION
iii. The date when the data was collected and the expected update frequency
May 2023
iv. Any use or publication restrictions, including cultural restrictions
None
v. A contact person or organisation
www.bps.waikatoregion.govt.nz/online-services/new/RequestForService/step/1?Subject=Policies,planningandstrategies
vi. Any quality/data health warnings
No