Sustainable Development Goals 6
WWP TARGET:
Increase the number of swimmable rivers and lakes in the Waikato from 30% (rivers) and 73% (lakes) in 2019 to both waterbodies achieving more than 80% by 2030.
ACHIEVING OUR TARGET MEANS THAT:
Our waterways contribute to the health of our region (like the veins of a healthy body). “I am the river, and the river is me. If the river is unwell, I am unwell.”
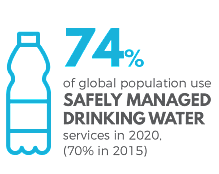
While access to safe drinking water and sanitation services is increasing, rates of progress for these basic services will need to quadruple for universal coverage to be reached by 2030. The health of waterbodies (rivers, lakes, aquifers and wetlands) is variable across the globe.

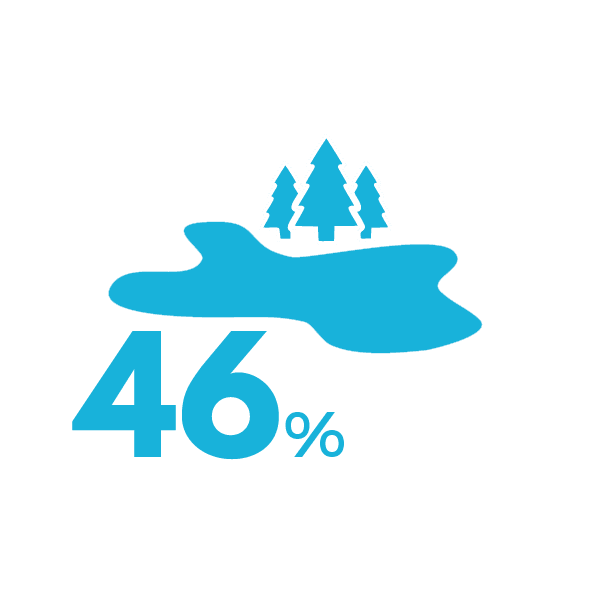
Of global population use safely managed sanitation (47% in 2015)
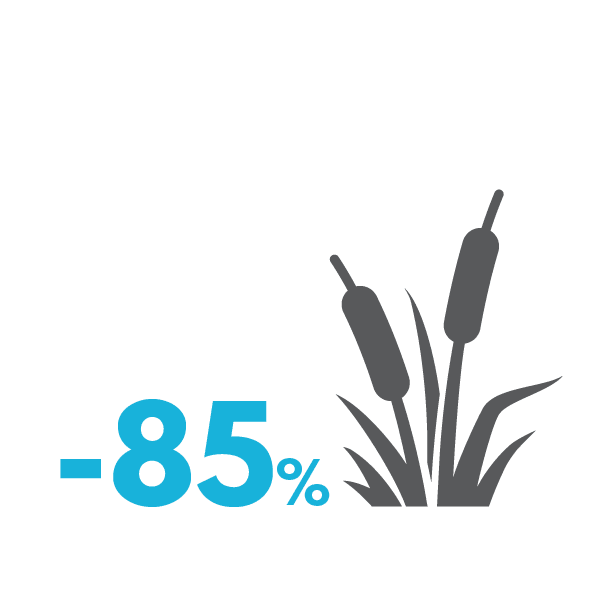
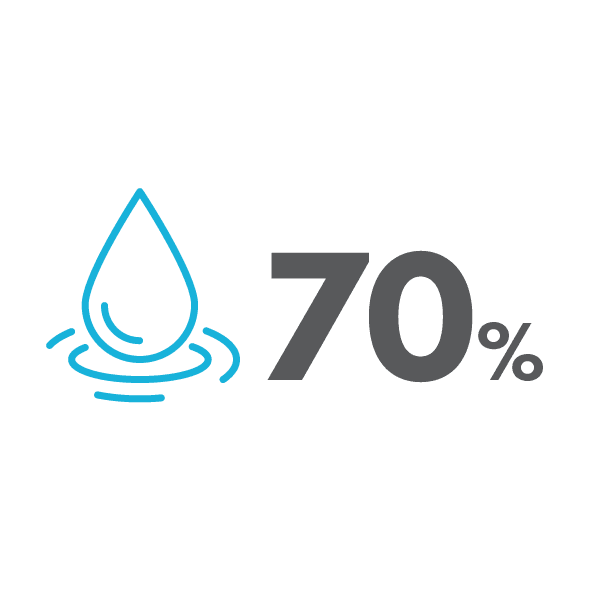
wetland ecosystems loss in extent over the past 300 years
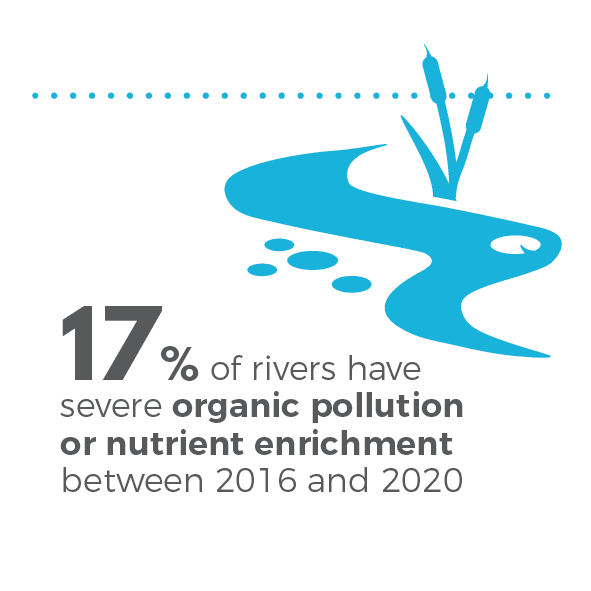
Many lakes and rivers have unnaturally high levels of nutrients due to leaching and run-off from urban or agricultural sources.
Freshwater river quality tends to be poorest near modified areas and is higher in areas that have had the least modification.
of the 3,813 lakes in Aotearoa rate poor
or very poor in terms of nutrient enrichment

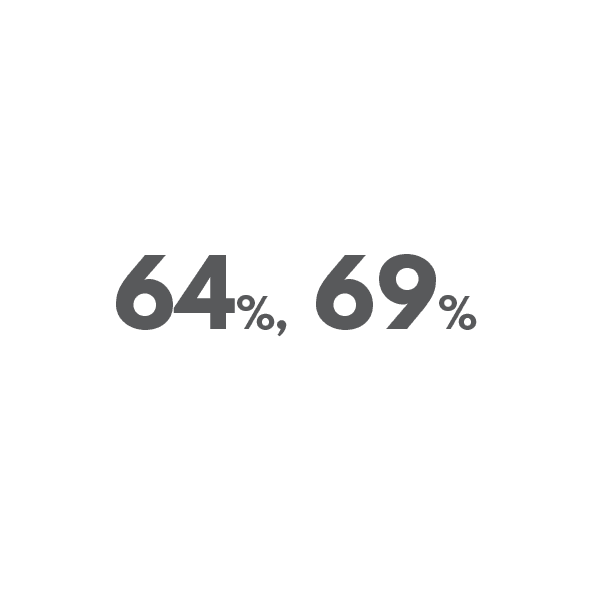
of rivers at risk of environmental impairment from forms of phosphorus and nitrogen

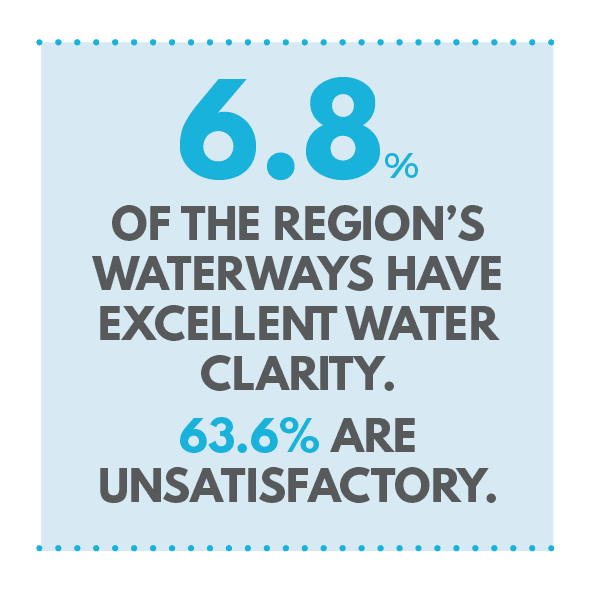
of river length at risk of environmental impairment from turbidity and visual clarity
River water quality for ecological health is generally good across the region. Where land use is more intensive, water quality for ecological health is poorer. Water quality in the Waikato River is much better than it was in the 1950s. Levels of nitrogen in the river have risen.
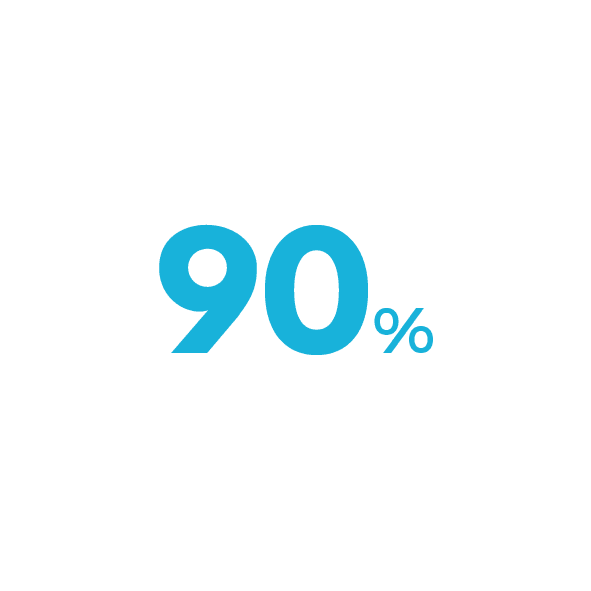
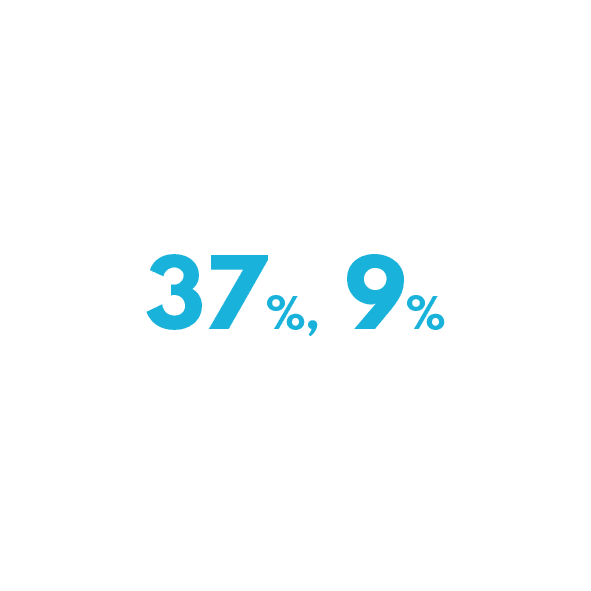
Allocation of total water available in the region, up from 85% in 2009

of rivers in the region have satisfactory overall quality (E. coli), no change from 2003
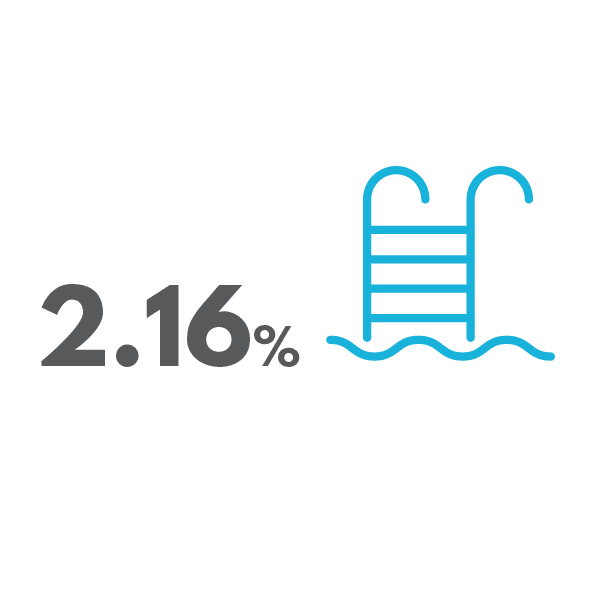
of the region’s waterways are excellent for swimming, 80.87% are unsatisfactory
WATER AND RIVER QUALITY INSIGHTS

Tell me more about this
i. An adequate description of the dataset
This report presents Waikato regional and territorial local authority results from a survey undertaken in parallel with the 2022 Quality of Life Survey (a collaboration between nine New Zealand councils including Hamilton).
ii. The source(s) of information
Waikato Regional Council
https://www.waikatoregion.govt.nz/services/publications/tr202249/
iii. The date when the data was collected and the expected update frequency
November 2022
iv. Any use or publication restrictions, including cultural restrictions
None
v. A contact person or organisation
www.bps.waikatoregion.govt.nz/online-services/new/RequestForService/step/1?Subject=Policies,planningandstrategies
vi. Any quality/data health warnings
No
Tell me more about this
i. An adequate description of the dataset
A set of indicators which measure the Waikato region’s progress by identifying our current situation and trends across each of 32 key economic, environmental and social aspects.
ii. The source(s) of information
Waikato Progress Indicators:
https://public.tableau.com/app/profile/waikato.regional.council/viz/WaikatoProgressIndicatorsDashboard_16862300344780/INTRODUCTION
iii. The date when the data was collected and the expected update frequency
May 2023
iv. Any use or publication restrictions, including cultural restrictions
None
v. A contact person or organisation
www.bps.waikatoregion.govt.nz/online-services/new/RequestForService/step/1?Subject=Policies,planningandstrategies
vi. Any quality/data health warnings
No
Tell me more about this
i. An adequate description of the dataset
This report presents Waikato regional and territorial local authority results from a survey undertaken in parallel with the 2022 Quality of Life Survey (a collaboration between nine New Zealand councils including Hamilton).
ii. The source(s) of information
Waikato Regional Council
www.waikatoregion.govt.nz/services/publications/tr202249/
iii. The date when the data was collected and the expected update frequency
November 2022
iv. Any use or publication restrictions, including cultural restrictions
None
v. A contact person or organisation
www.bps.waikatoregion.govt.nz/online-services/new/RequestForService/step/1?Subject=Policies,planningandstrategies
vi. Any quality/data health warnings
No